Smithii Research · Solana · August 2026
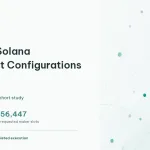
What 712 Solana Volume Bot Configurations Reveal
An anonymized study of the campaign goals and maker counts selected across a continuous 16-day cohort.
By Jorge Rodriguez Lora, co-founder and CEO of
Smithii
Published September 1, 2026 · Cohort: August 15–30, 2026
Key findings
Smithii analyzed 712 Solana Volume Bot configurations initialized by 320 unique wallets between August 15 and August 30, 2026. Together, those configurations requested 56,447 maker slots.
The records describe what users requested when they initialized a campaign. They do not establish completed execution, generated volume, profitability, ranking changes, or unique human participation.
- 89.7% selected a guided workflow. Boost Token, Target Price, and Buy Holders accounted for 639 of the 712 configurations. Advanced Bot accounted for 73.
- Campaign goal was associated with a different requested maker count. Target Price configurations requested 133.4 maker slots on average, compared with 61.8 for Boost Token.
- A total volume target does not describe a typical configuration. The cohort’s aggregate target was 7,563.01 SOL, but the snapshot does not contain a per-configuration median or percentiles.
- Wallets, configurations, maker slots, transactions, and people are different units. None can be converted directly into another without additional evidence.
Dataset and methodology
Cohort and inclusion criteria
| Measure | Aggregate value | Interpretation |
|---|---|---|
| Initialized configurations | 712 | Tracking records written when a campaign was initialized |
| Unique initiating wallets | 320 | Distinct initiating wallet identifiers, counted only in aggregate |
| Requested maker slots | 56,447 | Wallet slots requested across the configurations |
| Aggregate target volume | 7,563.01 SOL | Sum of requested targets, not executed volume |
| Observation period | 16 days | August 15 00:00 UTC to August 31 00:00 UTC, end-exclusive |
The source was Smithii’s centralized aggregate volume-tracking
records. The cohort contains legitimate Solana market-maker
configurations initialized during one continuous observation window.
What was excluded
The analysis included records with a non-null requested maker count and excluded one internal QA row. Wallet addresses, token addresses, transaction identifiers, and individual campaign outcomes were removed before preparing the public snapshot.
The configurations originated from the Smithii Solana Volume Bot. Smithii has a commercial interest in the category. This report publishes the aggregate fields needed to reproduce its descriptive findings: campaign mode, configuration count, requested maker count, target volume, network, and cohort boundaries.
A tracking record is created when a campaign initializes. For that reason, this report uses configured, requested, initialized, and target. It does not describe the recorded values as completed execution.
Campaign mode distribution
The cohort contained four campaign modes:
| Campaign mode | Configurations | Share | Requested maker slots | Average requested makers per configuration |
|---|---|---|---|---|
| Boost Token | 460 | 64.6% | 28,449 | 61.8 |
| Target Price | 167 | 23.5% | 22,276 | 133.4 |
| Advanced Bot | 73 | 10.3% | 4,818 | 66.0 |
| Buy Holders | 12 | 1.7% | 904 | 75.3 |
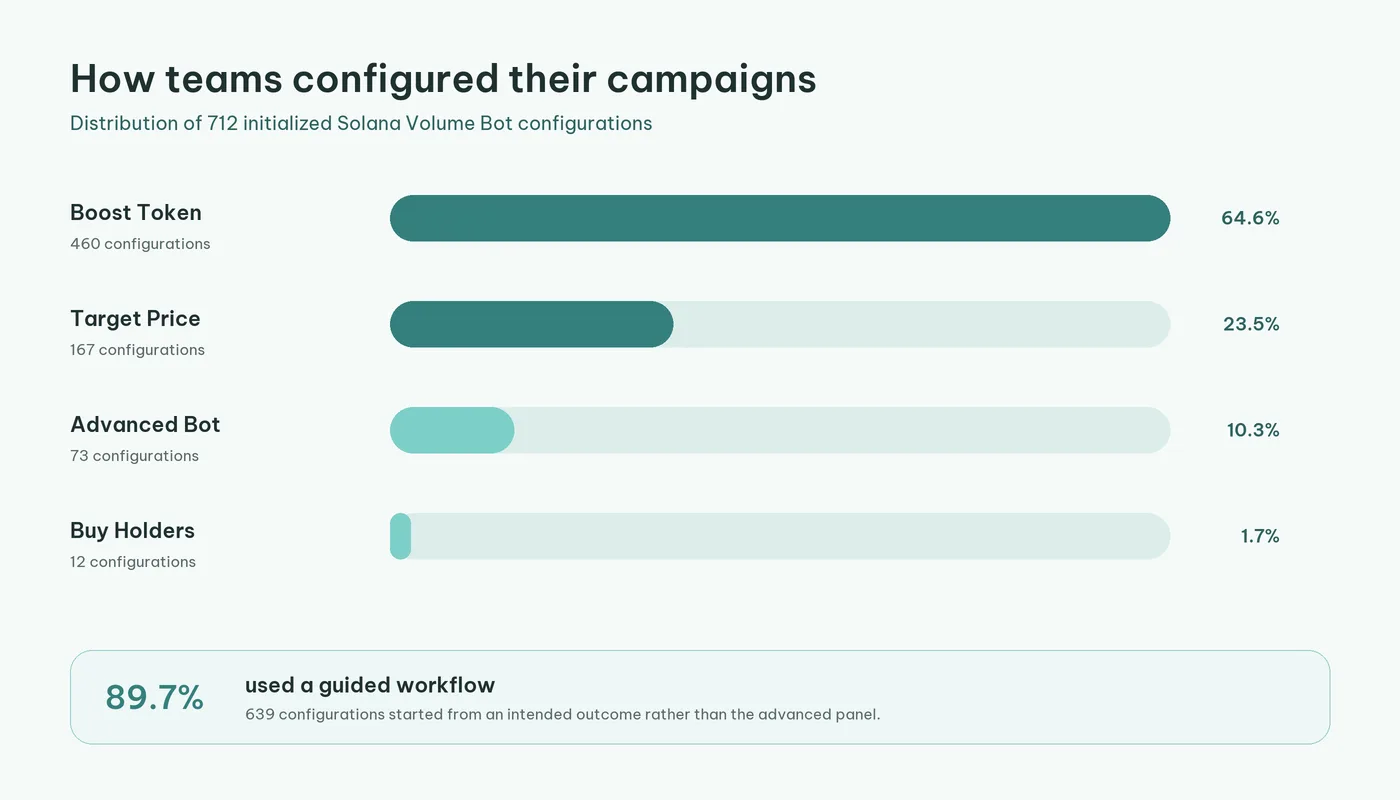
Boost Token, Target Price, and Buy Holders start from an intended campaign outcome. Together, these guided modes accounted for 639 configurations. Advanced Bot, which exposes the underlying settings directly, accounted for 73.
This finding describes product configuration behavior. It does not establish which mode performed better or why an individual user selected it.
Requested makers per configuration
Target Price represented 23.5% of configurations but 39.5% of all requested maker slots in the cohort. Its average of 133.4 requested makers per configuration was more than twice the Boost Token average of 61.8.
Advanced Bot averaged 66.0 requested makers. Buy Holders averaged 75.3, but its sample contained only 12 configurations, so it should not be treated as a stable benchmark.
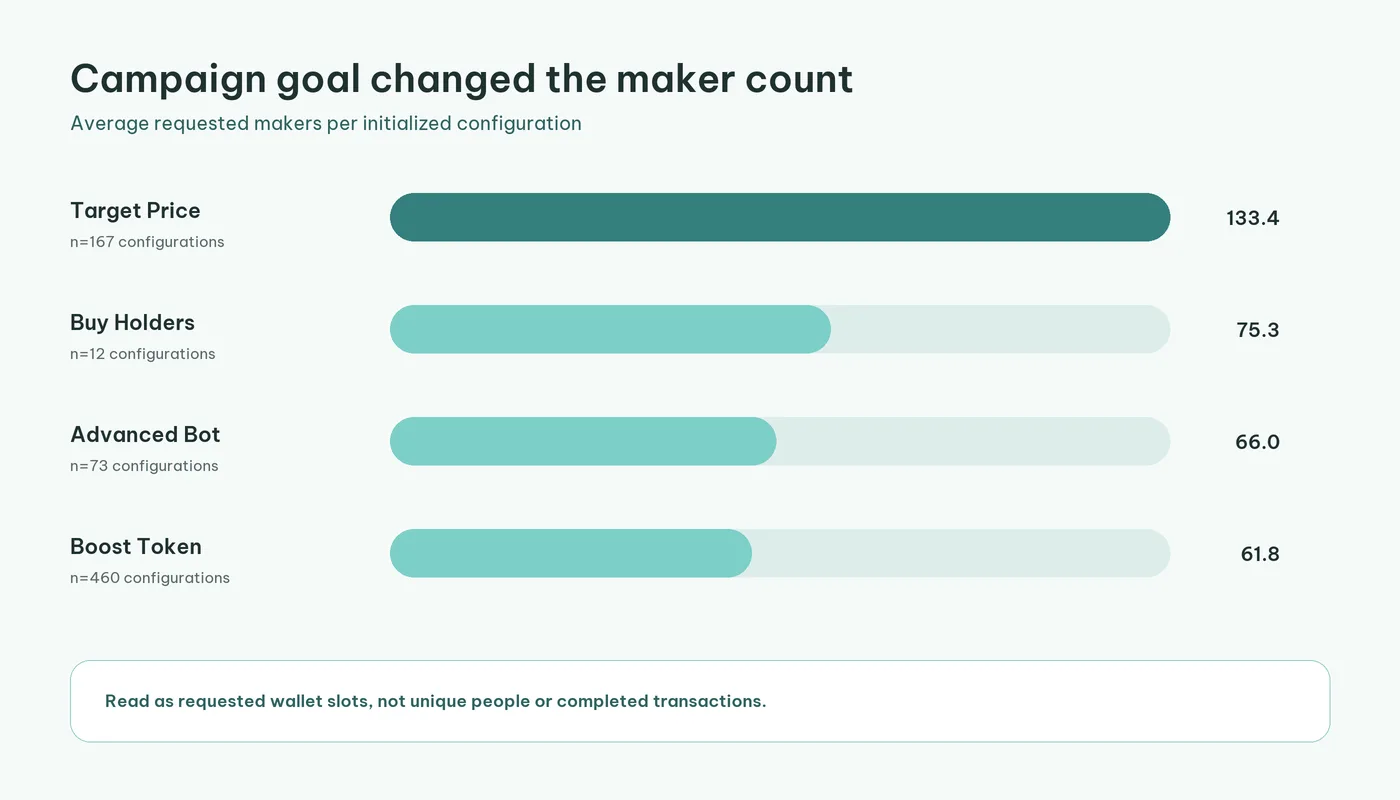
The result does not show that more maker slots produce a better outcome. It shows that configurations grouped by campaign goal requested materially different levels of wallet participation.
Why aggregate target volume does not describe a typical campaign
The 712 configurations contained an aggregate target volume of 7,563.01 SOL.
That total is valid for describing the sum of requested targets. It cannot describe a typical configuration because the public snapshot does not expose a median, quartiles, duration distribution, liquidity at execution time, or completed transaction data.
The same interpretation problem applies to market dashboards. DEX Screener documents volume as one of several inputs associated with its Trending Score, alongside liquidity, transactions, unique makers, holders, page activity, project information, boosts, and community engagement. A volume number is a real measurement, but it does not contain the structure behind the activity. See the DEX Screener Trending Score documentation.
Wallets, makers, transactions, and people are different units
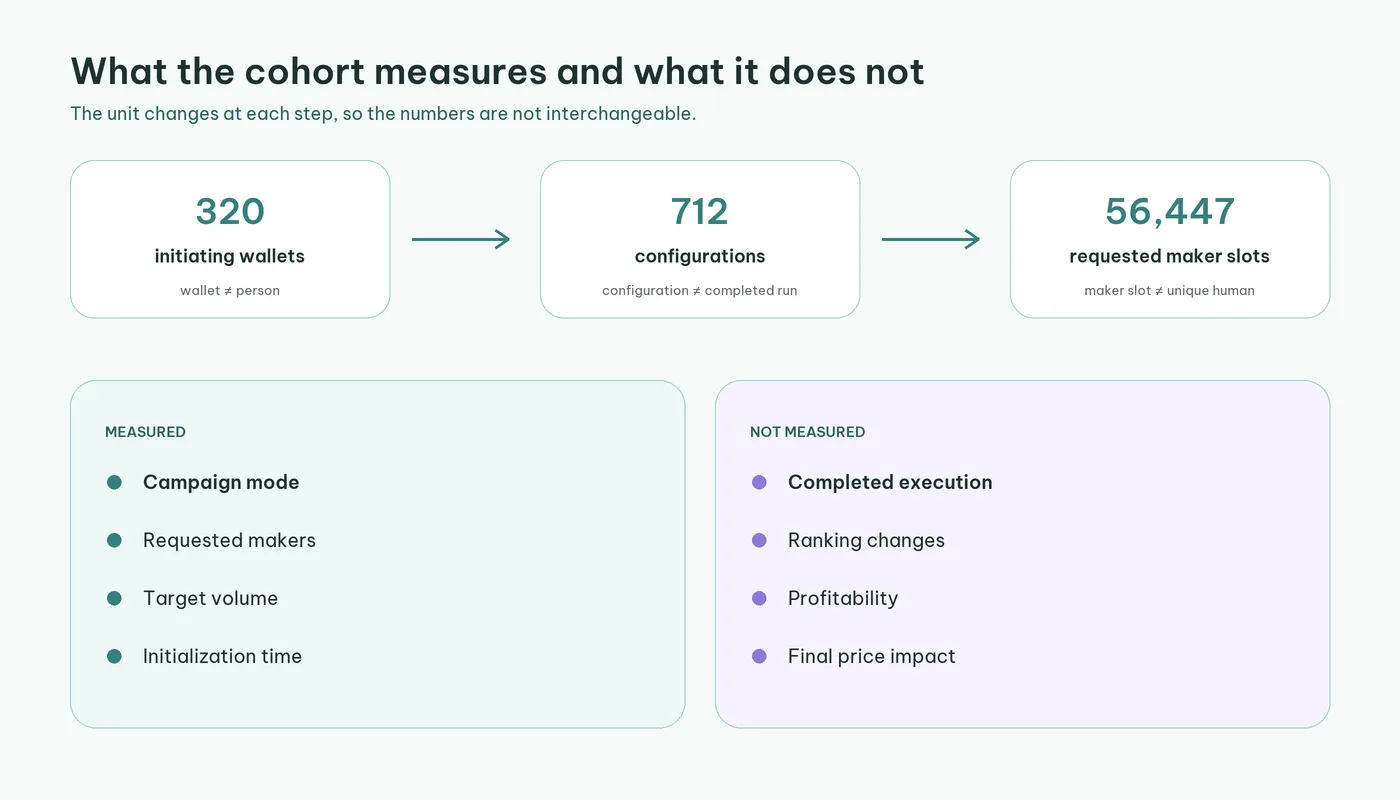
An initiating wallet is the wallet that configured a campaign. A requested maker is a wallet slot entered in the configuration. Neither represents a unique human.
A transaction is a different unit. Solana transactions contain one or more instructions and the signatures needed to authorize them. The instructions are processed atomically: they succeed together or their state changes revert together. One wallet can sign multiple transactions, and one transaction can contain multiple instructions. See the Solana transaction documentation.
DEX Screener similarly exposes transactions, volume, liquidity, price changes, and pair data as separate fields. See the DEX Screener API reference.
What this study measures, and what it does not
Measured
- Campaign mode.
- Requested maker count.
- Target volume stored at initialization.
- Network.
- Initialization timestamp.
- Unique initiating wallet count in aggregate.
Not measured
- Completed campaign execution.
- Confirmed or displayed trading volume.
- Ranking or trending changes.
- Trader acquisition or unique people.
- Profitability.
- Pool liquidity at execution time.
- Final price impact.
- Retention.
The cohort averages 2.23 configurations per initiating wallet, but that is not a retention rate. A retention claim would require a wallet-level frequency distribution and a defined return window.
Download the aggregate dataset
The file contains aggregate values only. It does not contain wallet addresses, token addresses, transaction identifiers, or individual campaign outcomes.
Sources and citation
Suggested citation
Smithii Research. “What 712 Solana Volume Bot Configurations Reveal.”
Smithii LTD, September 1, 2026.
https://smithii.io/en/research/solana-volume-bot-configurations/. DOI: 10.5281/zenodo.22217279.
Archived dataset: Zenodo record · public GitHub repository.
Corrections and updates
If a material error is identified, Smithii Research will update the
report, record the change on this page, and advance
dateModified. Methodology or dataset changes will result in
a new version identifier.
Questions about this dataset can be sent to jorge@smithii.io.
Read more original analysis in Smithii Research or review the Smithii editorial policy.